Free Monthly Core Web Vitals Report
How To Setup Your Free Monthly Site Speed Report
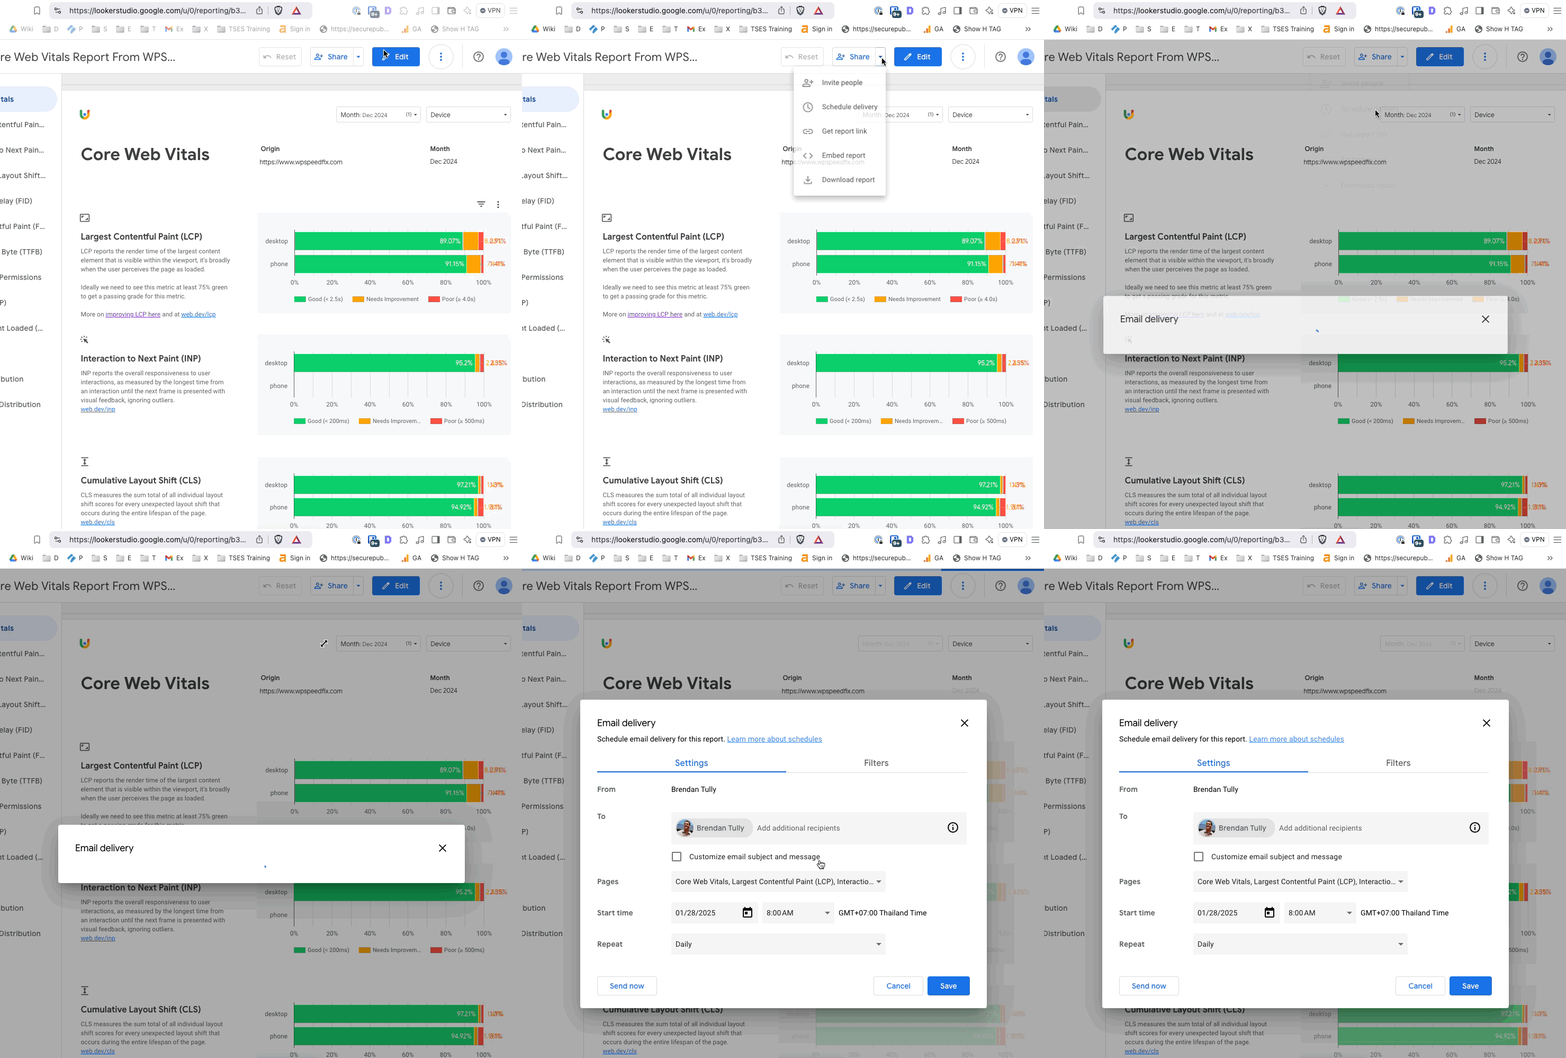
We’ve had a Core Web Vitals Report tool live on our website for years now but most people don’t realize that this report can be configured to email you an update each month with the previous month’s speed data.
This report is an excellent way to keep track of your overall site speed and make sure everything is running OK. It’s a high level report that shows the Core Web Vitals speed data across your entire site as well as 12 months of site speed history. It’s also a fantastic report to use if you’re an agency or marketing manager and need to report on marketing activity on an ongoing basis.
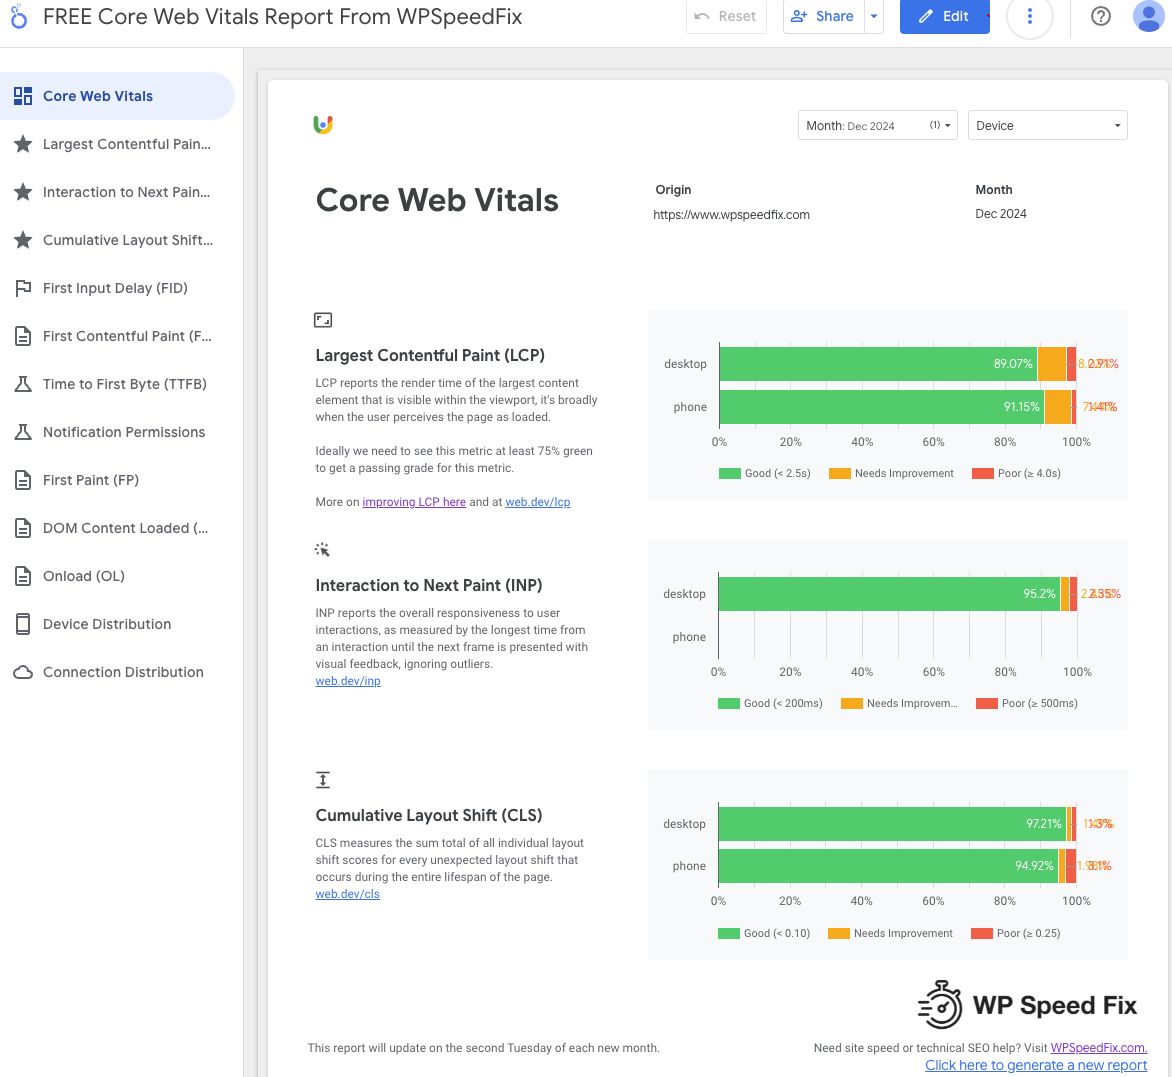
To setup the monthly emails takes less than 5 minutes and is quite simple. You just need a Google or free Gmail account in order to copy the report into your own Google Looker Studio account. You can also edit the report to add your own brand and logo too.
The only thing you need to make this work is a website that has 50+ visits a day as this is roughly the cutoff for Google to keep a Core Web Vitals dataset for your site. The report pulls from Google’s publicly available dataset so the reports can also be setup to track competitor sites too.
You can setup the initial report at this link and then click here to watch the video that walks you through the process of cloning the report and configuring the monthly email update.
If you want to see an example of what this report looks like, click here to see the report for our site. Broadly speaking, each metric needs to be at least 75% or more in the green zone for Google to consider your website to be passing Core Web Vitals and to be “fast”.
The tabs on the left show several other metrics that are also important.
The Time To First Byte or TTFB metric is particularly important and while it’s not a Core Web Vital metric, it does have a downstream impact on other metrics. It’s also critical that the TTFB be good (say 60-70%+ green) if you’re running paid traffic. If you’re seeing a large portion of red in the TTFB section, say 40-50% red or 80% like the image below, then a large portion of users will seeing a blank screen for ~2 seconds while waiting for your site to load.
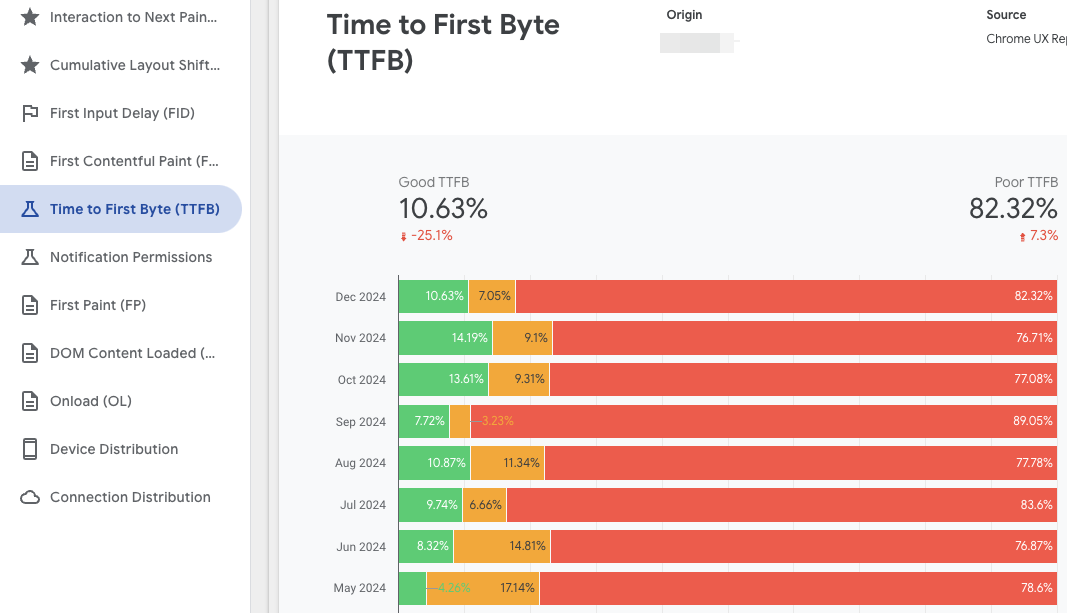
Above: TTFB is a key metric even though it’s not a “Core Web Vital”, when we see a large portion of red like this visitors will be staring at a blank screen for several seconds before anything starts happening
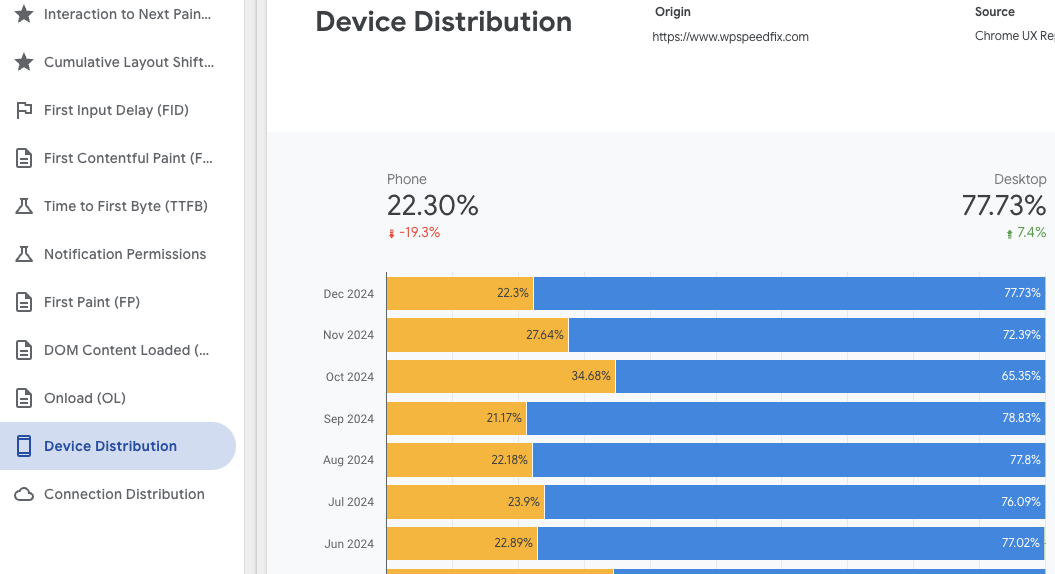
The Device Distribution tab is also useful is determining the percentage of mobile vs desktop users to your site. There’s a common misconception that mobile is the most important device to focus on but some sites get very little mobile traffic. You’ll see with our WPSpeedFix site below, mobile is only ~23% of our overall traffic which means our desktop experience is a better place to put our focus and efforts.
As per above, you can setup the initial report at this link and then click here to watch the video that walks you through the process of cloning the report and configuring the monthly email update.
Thats it for this email, any questions, just hit reply.
First sent to the WP Speed Fix email list on 28 January 2025. Read the original on Bento Subscribe to the list